What Is This?
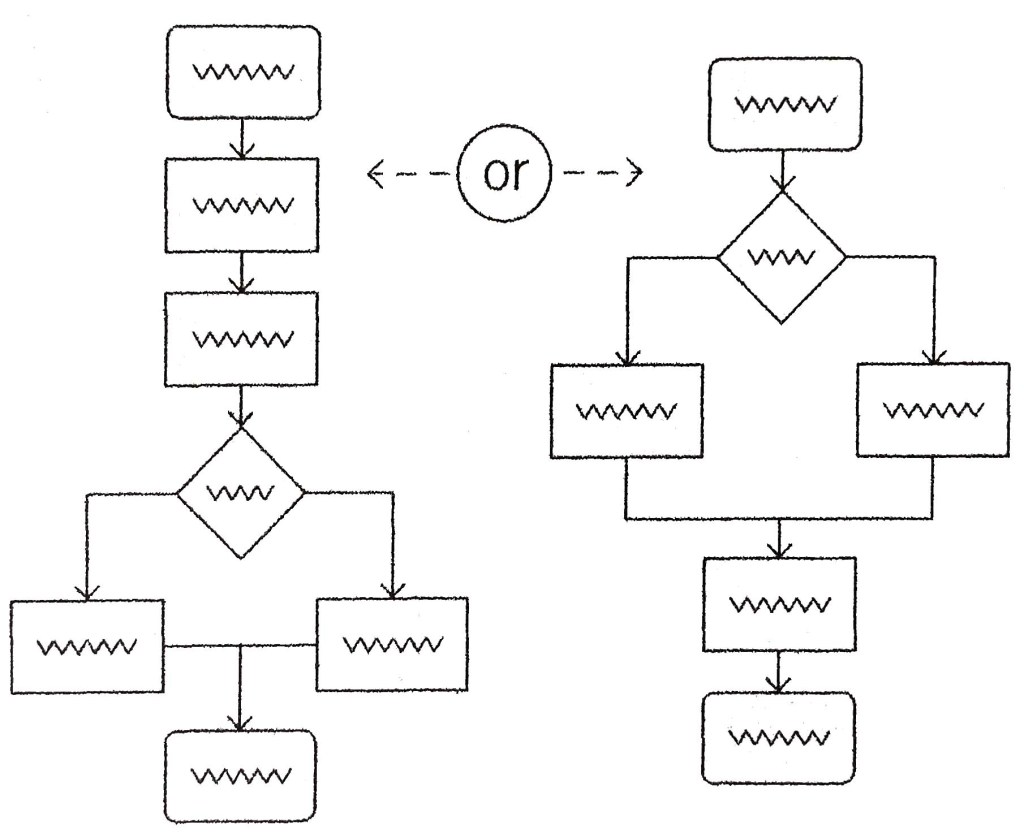
As-is and to-be analysis is a research method used in the field of user experience. In the book UX Methods: A Quick Guide to User Experience Research Methods authors James Pannafino and Patrick McNeil define it as “… a visual comparison method where the current state (as-is) of the product or system is shown next to the future (to-be) state.” The as-is and to-be states can be displayed next to each, typically in the style of a flowchart, other to allow the designer to present the future changes that will be made to the product or system. By doing so, it will highlight how the product will be improved as a result of these changes.
There are many benefits that as-is and to-be analysis. The article, “The Basics of Documenting and Analyzing Your As-Is Process” explains that some of the benefits of this method include, “… saving money, improving existing processes or creating new processes, increasing customer satisfaction, improving business coordination and organizational responsiveness.” Though it is a fairly simple process, the potential benefits are tremendous.
Step One: Establish User Goals

Before beginning the process of this analysis, it is important to establish the goals that users will have when they use your product or system. For example, if you were designing an app for a rental car business, a user’s goal could be to find and book a rental car that fits their needs through the app. By identifying this goal, you are considering the user’s thought process and ideal interaction with your product. This allows you to have a better scope of how the product should work to enable users to reach their goals. Additionally, by doing so, everyone on your team will be on the same page and have the same understanding of what changes and adjustments will need to be made.
Step Two: Map Out As-Is State
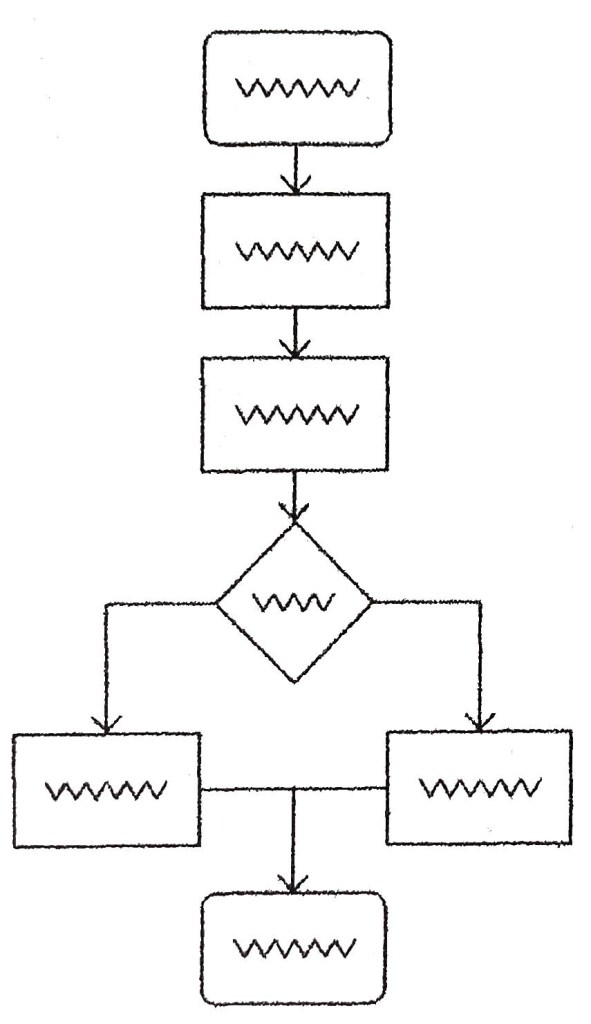
The as-is state should display exactly how the product currently is, and how it functions. This should be visual, you can use flowcharts, note cards, a whiteboard or sketchbook drawing, or any other form of a visual map to show the current state of the product. By displaying the current state to others (potential users, stakeholders, team members, etc.) you may uncover other existing issues that you may not have previously noticed. “The as-is phase outlines the current state of your process and any gaps or issues with the current mode of operation” (“The Basics of Documenting and Analyzing Your As-Is Process”). Once the as-is state is mapped out, you can make notations or highlight any areas that will be changed or new areas that could be added.
Step Three: Map Out To-Be State
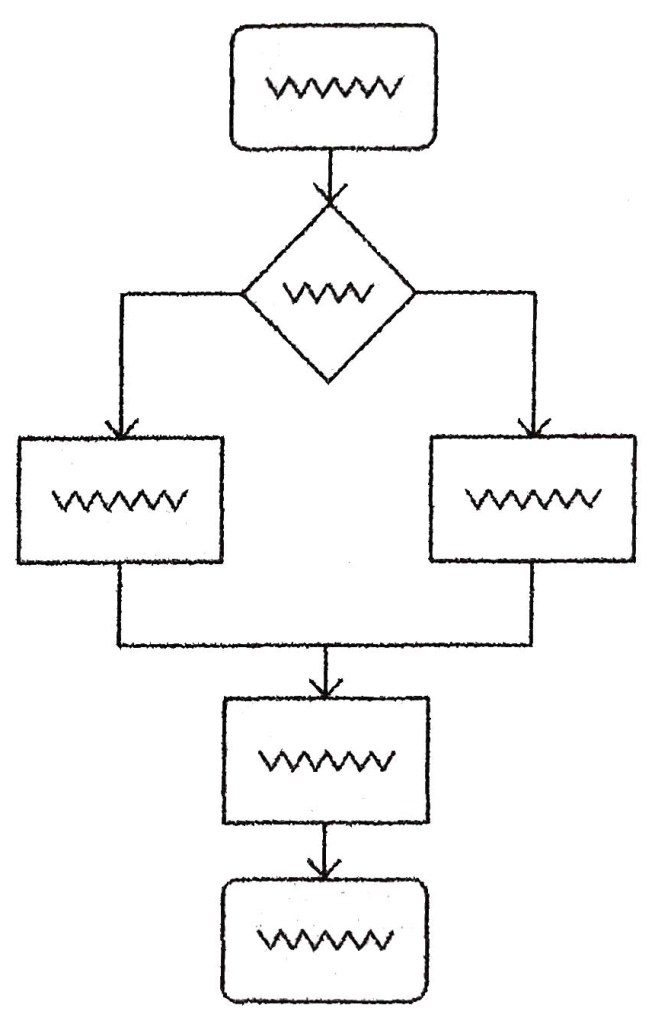
With all of the comments considered and areas of improvement identified, you can begin to map out the to-be state. This can be done in the same format as the as-is state, with whatever visual representation method that you chose. With your user goals and notations in mind, map out another possible state the product could exist in. This will be your future, to-be state. “Keeping records of both current and future state documents will help everyone in the organization maintain process consistency and track progress and outcomes more effectively” (“The Basics of Documenting and Analyzing Your As-Is Process”). The to-be state can demonstrate what changes will be made, so all team members are on the same page moving to the next phase of the analysis.
Step Four: Compare

The visual aspect of this method is crucial. Authors Pannafino and McNeil explain, “… in some cases, it can be difficult for non-users of a system to understand the significance of even small changes to the workflow. By visualizing them side-by-side these important nuances can be more fully understood.” Because this method can be done in a low-stakes, low-stress environment, questions can be asked and answered by team members quickly and easily with a simple demonstration through the differences between the two states. A discussion can be held to talk about why the future state would function better than the current state.
Examples
According to the article, “As Is – To Be: The Essential Business Model for Improvement” the Quality Management team of the New Charter’s Group utilized this method to translate their paper-based management system into a digital system. This method enabled them to do so, while also saving them £350k each year following the change. This highlights the money-saving component that could develop as a result of utilizing the as-is and to-be analysis.
Also, the article. “What is Process Mapping? Benefits and Examples of Process Maps” explains that a healthcare trust needed a solution for healthcare staff to securely access patient information. By utilizing the as-is and to-be product mapping, a solution was found and utilized in under four weeks. The solution greatly reduced the time needed for healthcare staff to securely access their patient’s information.
Wrapping Up
This method of analyzing product states can not only provide insight for you, but also your team and anyone else who may be involved in your product redesign. It is important to ensure that everyone is on the same page and has the same understanding of the process before moving on to the next step throughout the process. Try it out on your product, and see what it can do for you!

Leave a comment