
What is Twitter Keyword Analysis?
With the growth of social media, also comes the growth of social media analytics. Now, more than ever, businesses are able to utilize social media and social media data and statistics to improve their business strategy. Regarding conversations on social media, Twitter is one of the best platforms to analyze keyword data and trends. Author, Rebecca Walker explains, “The Twitter Keyword Report analyzes Tweets and quantifies total volume, average volume per day and growth as well as a sampling of those tweets and engagements.” The analysis of Twitter keyword reports allows for an understanding of the volume of conversation surrounding specific topics, as well as its growth over a predetermined time period. For the purpose of this article, I utilized the Twitter Keyword Analysis tool from Sprout Social.
What are the Advantages of Twitter Keyword Analysis?
The benefits of Twitter keyword analysis are endless depending on how you utilize them. Analyzing keyword data over time provides an understanding of when a keyword was most and least relevant. This allows businesses to adjust their social media strategy around the relevance of certain topics. For example, the conversation around the Superbowl is typically the highest around February. By understanding this, brands are able to take part in this conversation when it is most relevant and engage with their audience accordingly. Another benefit involves competitive analysis. Twitter keyword analysis allows businesses to look at the statistics and data regarding conversations surrounding themselves and their competitors. It facilitates the comparison of volume from one brand to the next. However, there are many different ways to utilize this analysis, and the benefits it could provide are limitless.
Examples
As a full-time user experience designer, I recently conducted a Twitter keyword analysis for keywords related to user experience design. The keywords I chose were: Adobe XD, Figma, UI Designer, and UX Designer.
Below, you can see the keyword volume from January 1, 2022, to today September 18, 2022. This analysis shows the volume of each keyword from month to month, and you can see the growth for each keyword.

Below I’ve included two graphs with the actual numbers from January 2022 and September 2022. Here you can see the difference in the numbers from the beginning of the year to today.


The graph below highlights the share of volume of the entire conversation involving all of these keywords. You can see that Figma takes up well over half of the volume and is the only keyword with a positive trend. Recently, it was announced that Adobe was purchasing Figma, so the high volume involving this keyword is not surprising.

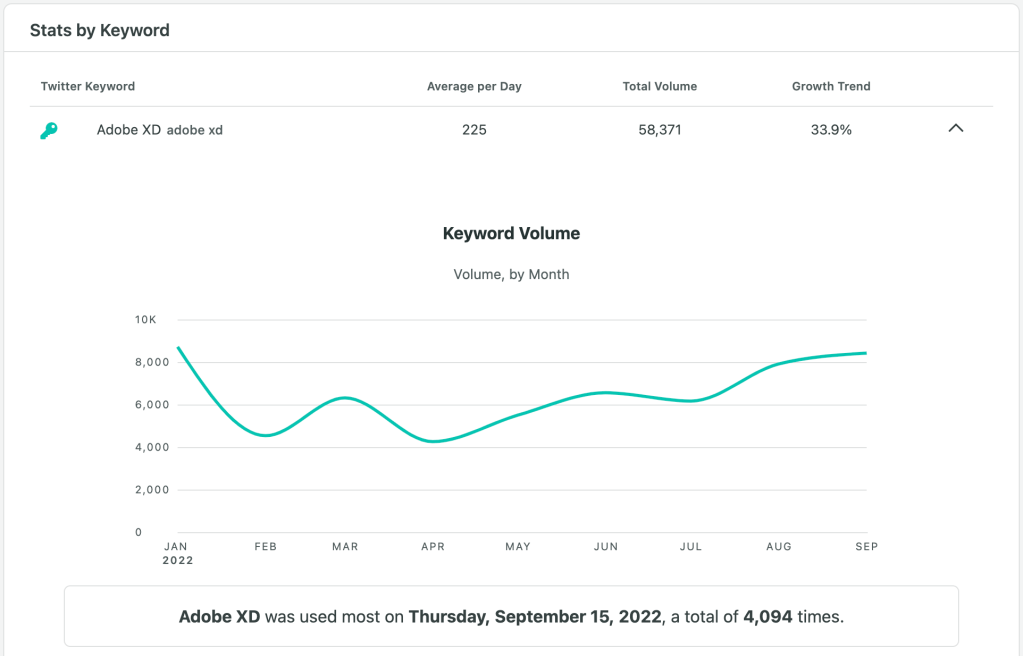
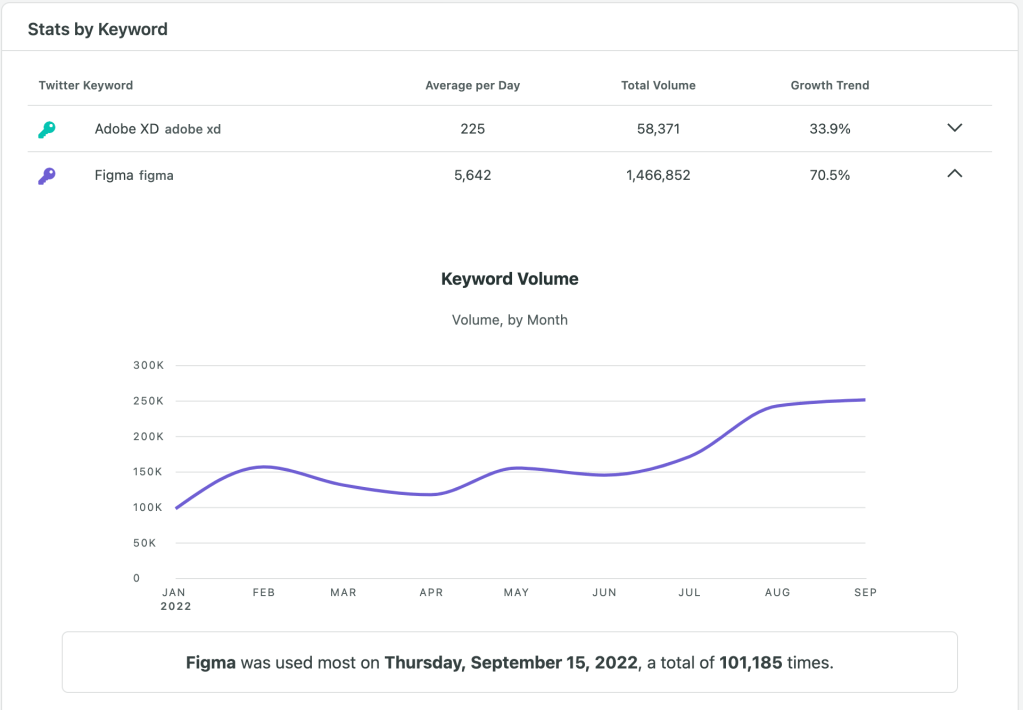
The graphs below represent the stats of each specific keyword, the average tweets including the keyword each day, its total volume, its growth trend, and when it was used the most during the predetermined period of time.


Wrapping Up
Looking into the details of conversation surrounding a specific topic or keywords can provide valuable insight to be utilized in social media strategy. Author, Jacqueline Zote explains, “Even if you log in daily and generally understand how the account is performing, it’s essential to put numbers to those feelings.” Try using Sprout Social’s Twitter keyword analysis and see what benefits it could provide you with!

Leave a comment